IP3 ASSESS is a web-based data solution designed and built for changemakers using data to advance equitable well-being in communities around the Nation. It includes a robust starter list of indicators, interactive maps, and simple, shareable reporting.
IP3 ASSESS Product Features
-
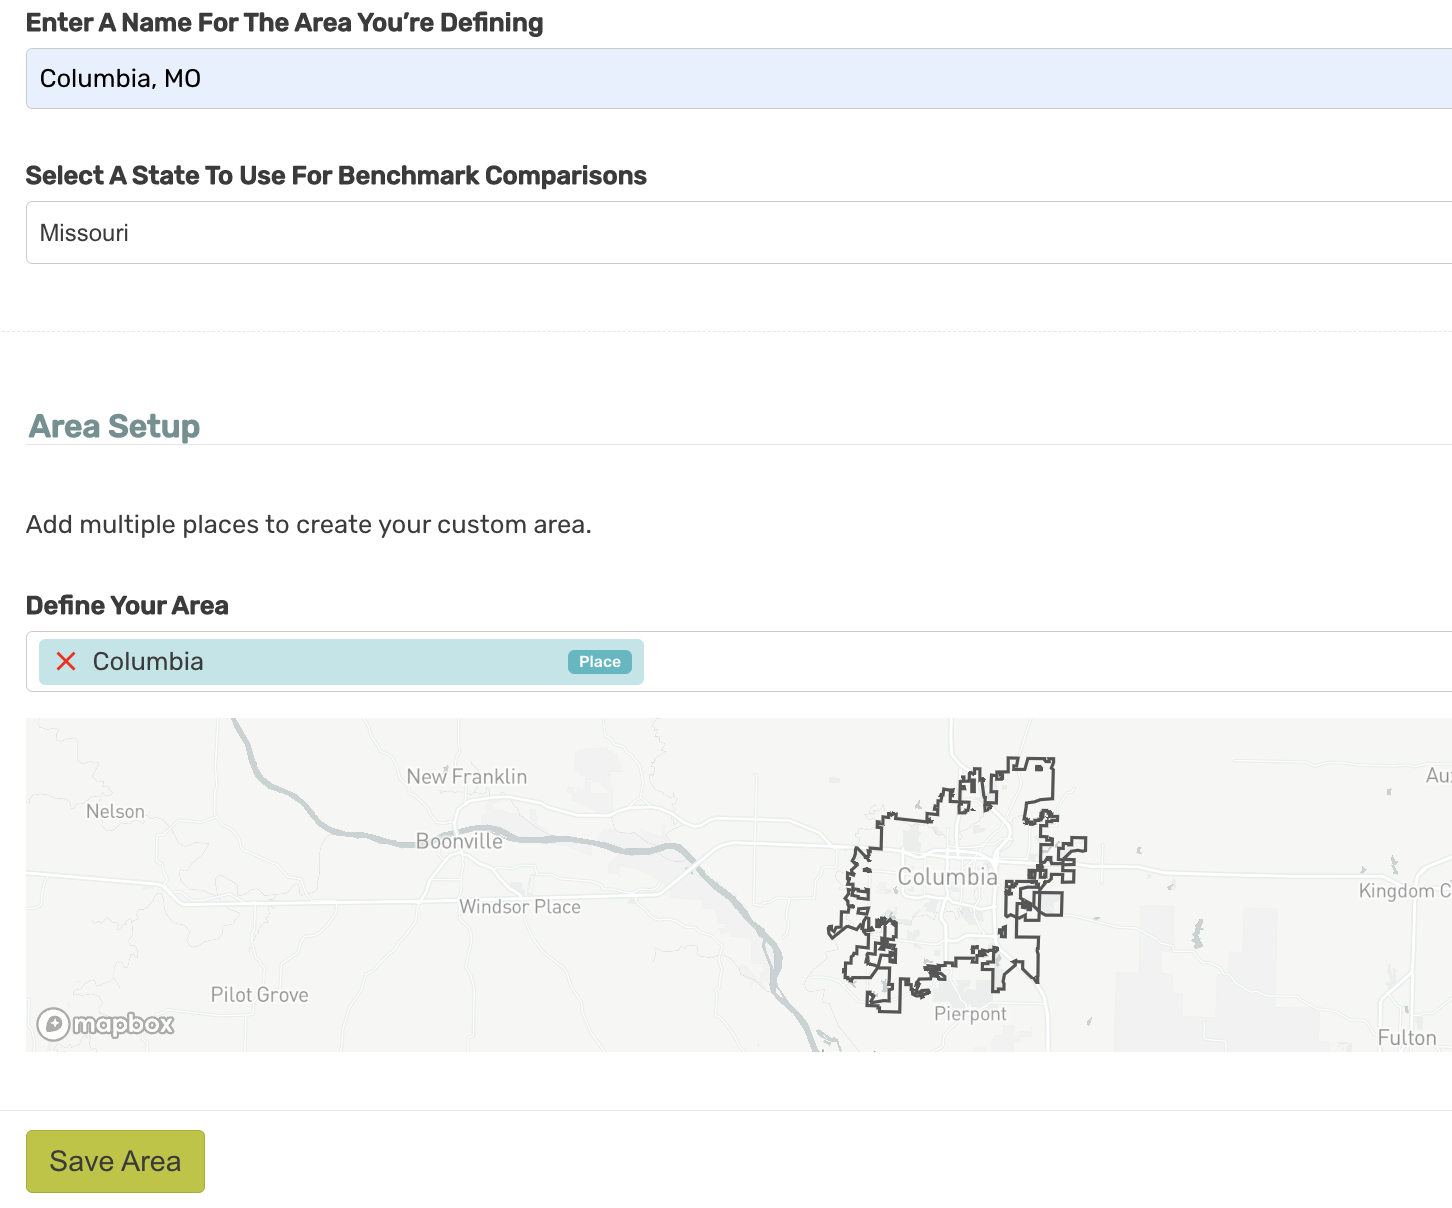
Build your own geographies
Create and manage custom areas using the simple area builder. Areas can be built from individual or groups of census tracts, zip codes, cities, counties, or states. Areas made up of more than one geographic entity (e.g. multiple zip codes) can include contiguous or non-contiguous areas. Users can explore data for each geography configured on the platform.
-

Data organized by frameworks
Frameworks can be applied to quantitative data to help us more-effectively use data to inform our work. Data frameworks are arranged into a simple series of “domains” (or categories) that organize a set of indicators that measure community health and well-being. This powerful way of framing data helps us account for local conditions instead of generalizing or making assumptions. Toggle between frameworks to explore different data for the same geography.
-

Compare to state and national benchmarks
The “fuel gauge” visualizations depict z-scores for indicators relative to the selected benchmark (usually either the corresponding state average or the national average). This approach allows an "apples to apples" comparison of data from a variety of sources and with a variety of units and collection methods. The fuel gauge is red if an indicator scores worse than the benchmark and green if the data are better than the benchmark, so users quickly see how an area performs, simplifying interpretation of data across the platform.
-
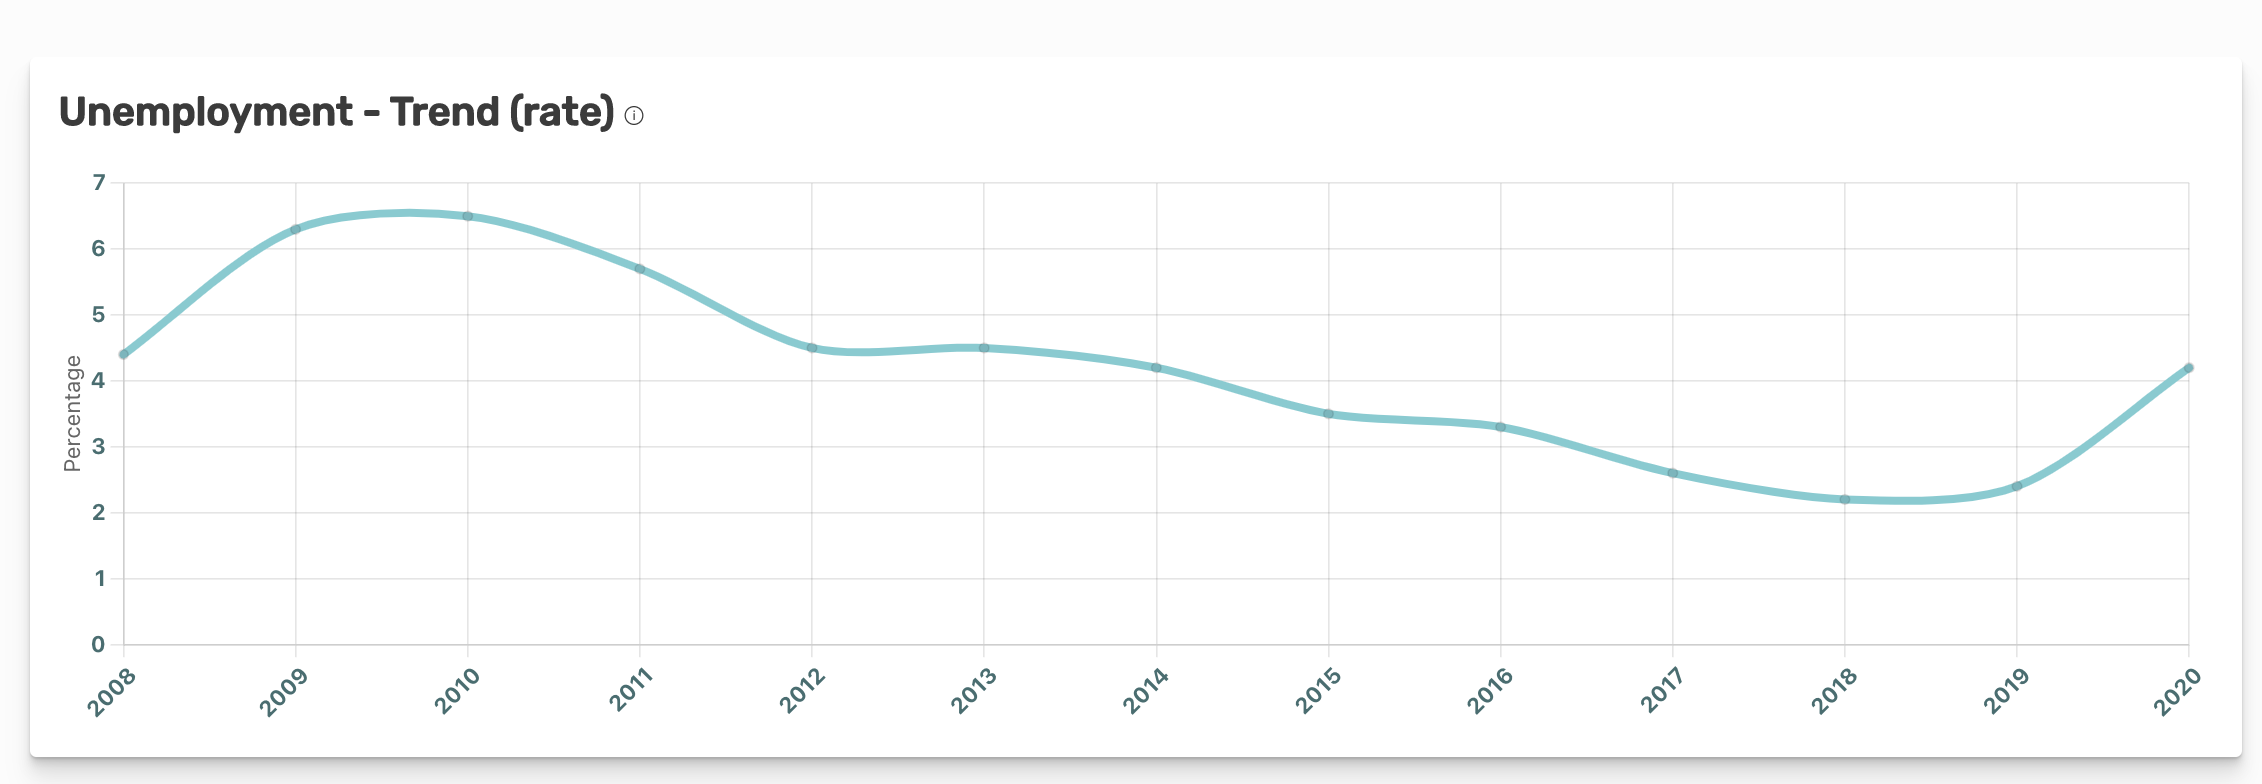
Trends over time
When data are available from multiple years on the platform, a dynamic trend line graph shows time series data for any indicator and geography. Time series graphs are also available as report widgets, so users can highlight changes in a given indicator and geographic area over time.
-

Race and ethnicity data
Whenever available from the original source of the data, population breakout data are always shown on the platform. Dynamic bar charts show race and/or ethnicity breakouts for a given indicator and geographic area. Bar charts are also available as report widgets, so users can highlight differences and similarities across population groups.
-

Maps
Heat maps show how data for a given indicator vary across a geographic area. Heat maps are also available as report widgets, so users can highlight variations in a given indicator across a geographic area and easily compare nearby neighborhoods.
Customizable Reports to Create Data Dashboards
Reports enable users to highlight a specific set of data—around a framework, topic area, project—and share data and data visualizations with staff, partners, stakeholders, and funders. Create, manage and duplicate reports using our simple widget library, and/or work with our team to create a custom report template for you. Embed custom reports on your own website to create a shareable online data dashboard. Create a report that is specific to one geographic area, or use the drop down at the top right to see data for all areas configured on the platform—when you select a new area, the data automatically update to reflect data describing the corresponding community. See a sample report.
Explore how our clients make an impact with IP3 ASSESS reports:
-
![]()
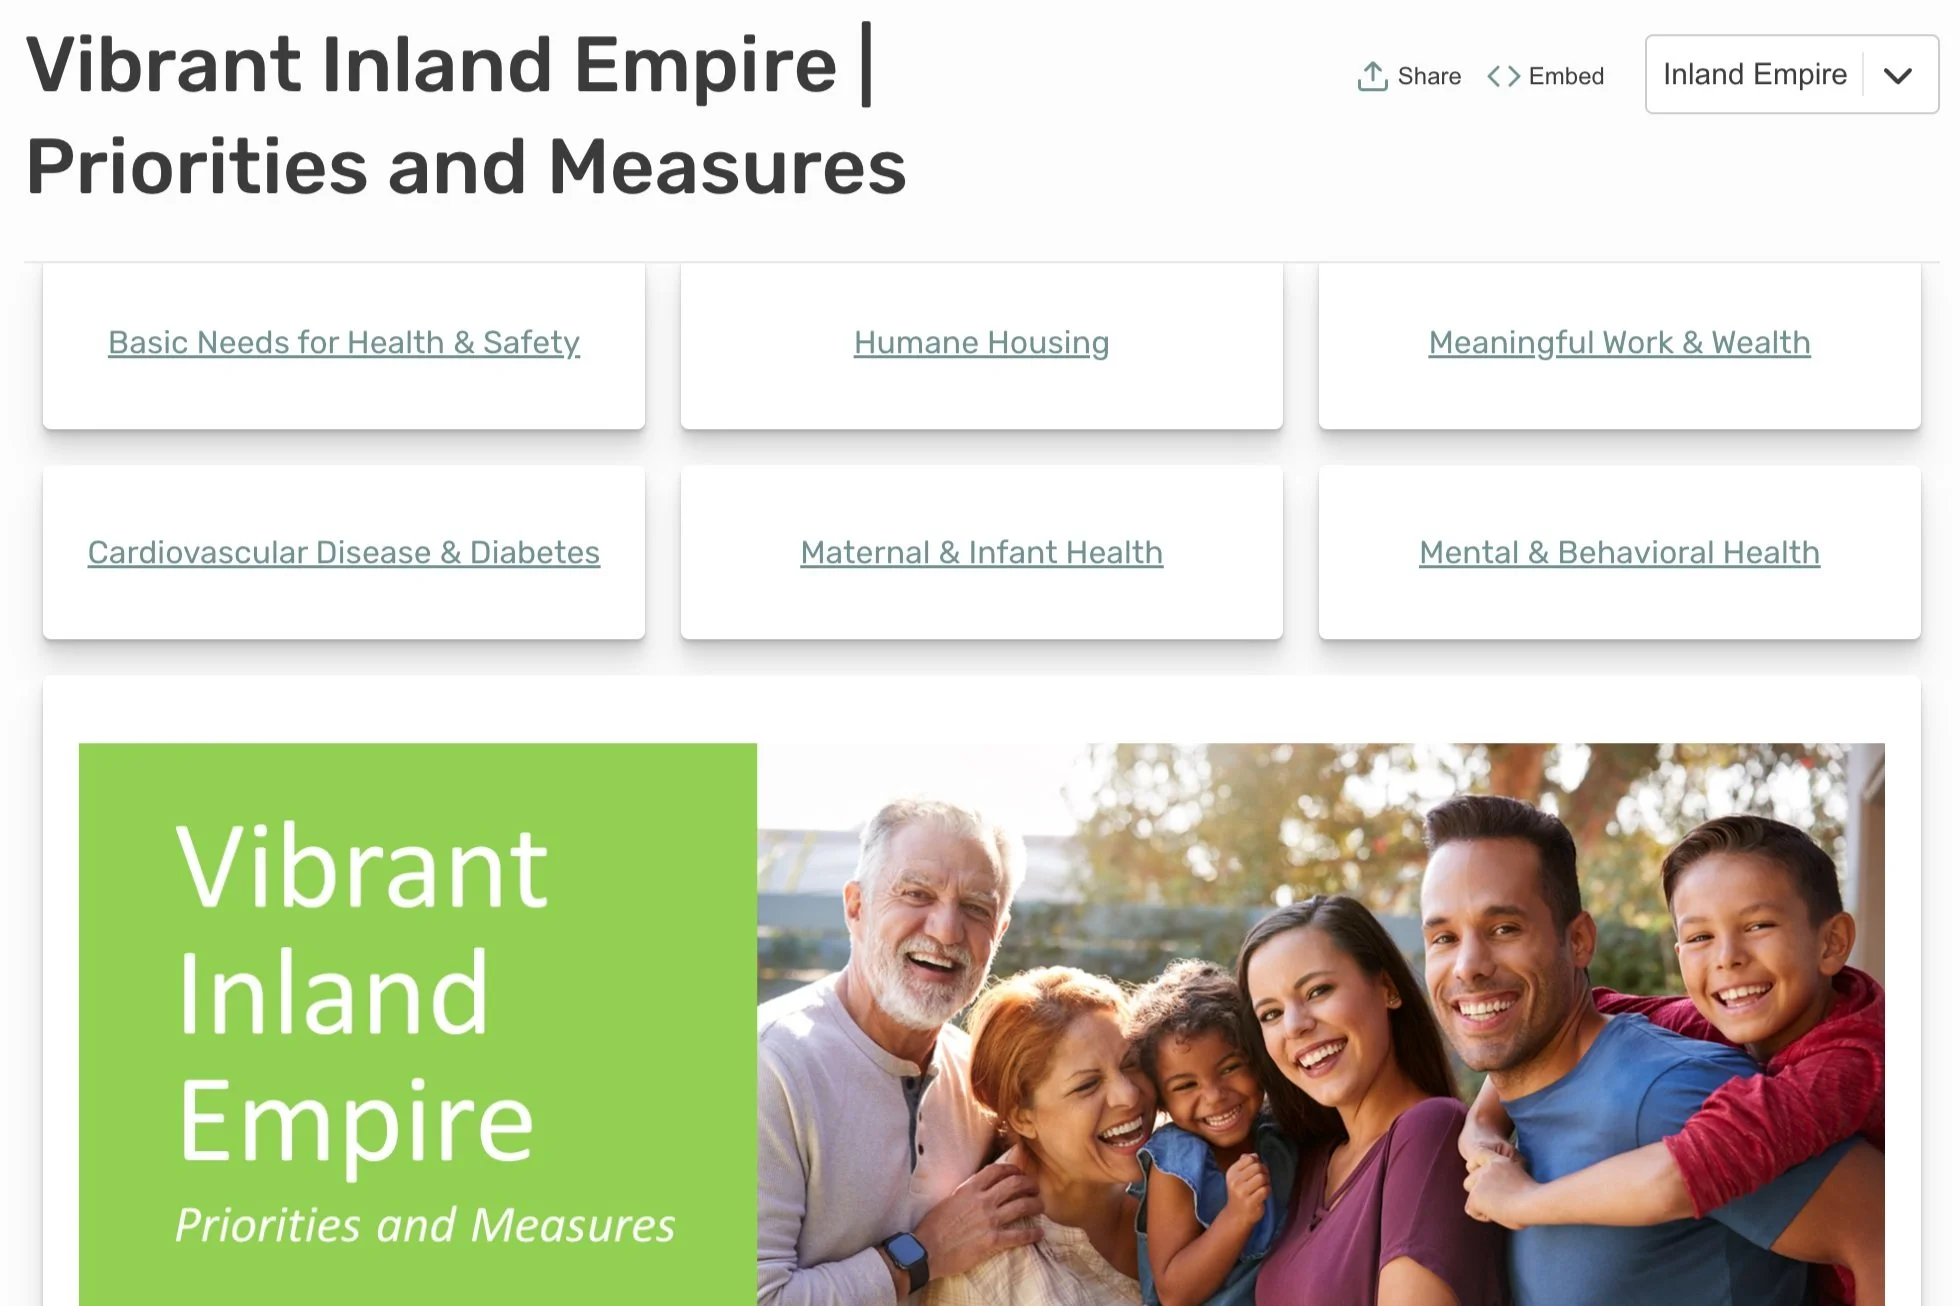
Vibrant Inland Empire
Inland Empire Health Plan (IEHP) is a top 10 largest Medicaid health plan. IEHP leveraged IP3 ASSESS to support their Community Health Needs Assessment (CHNA). IP3 ASSESS enabled the group of stakeholders leading the CHNA process to quickly complete the formal CHNA and share data with partners and stakeholders.
-
![]()
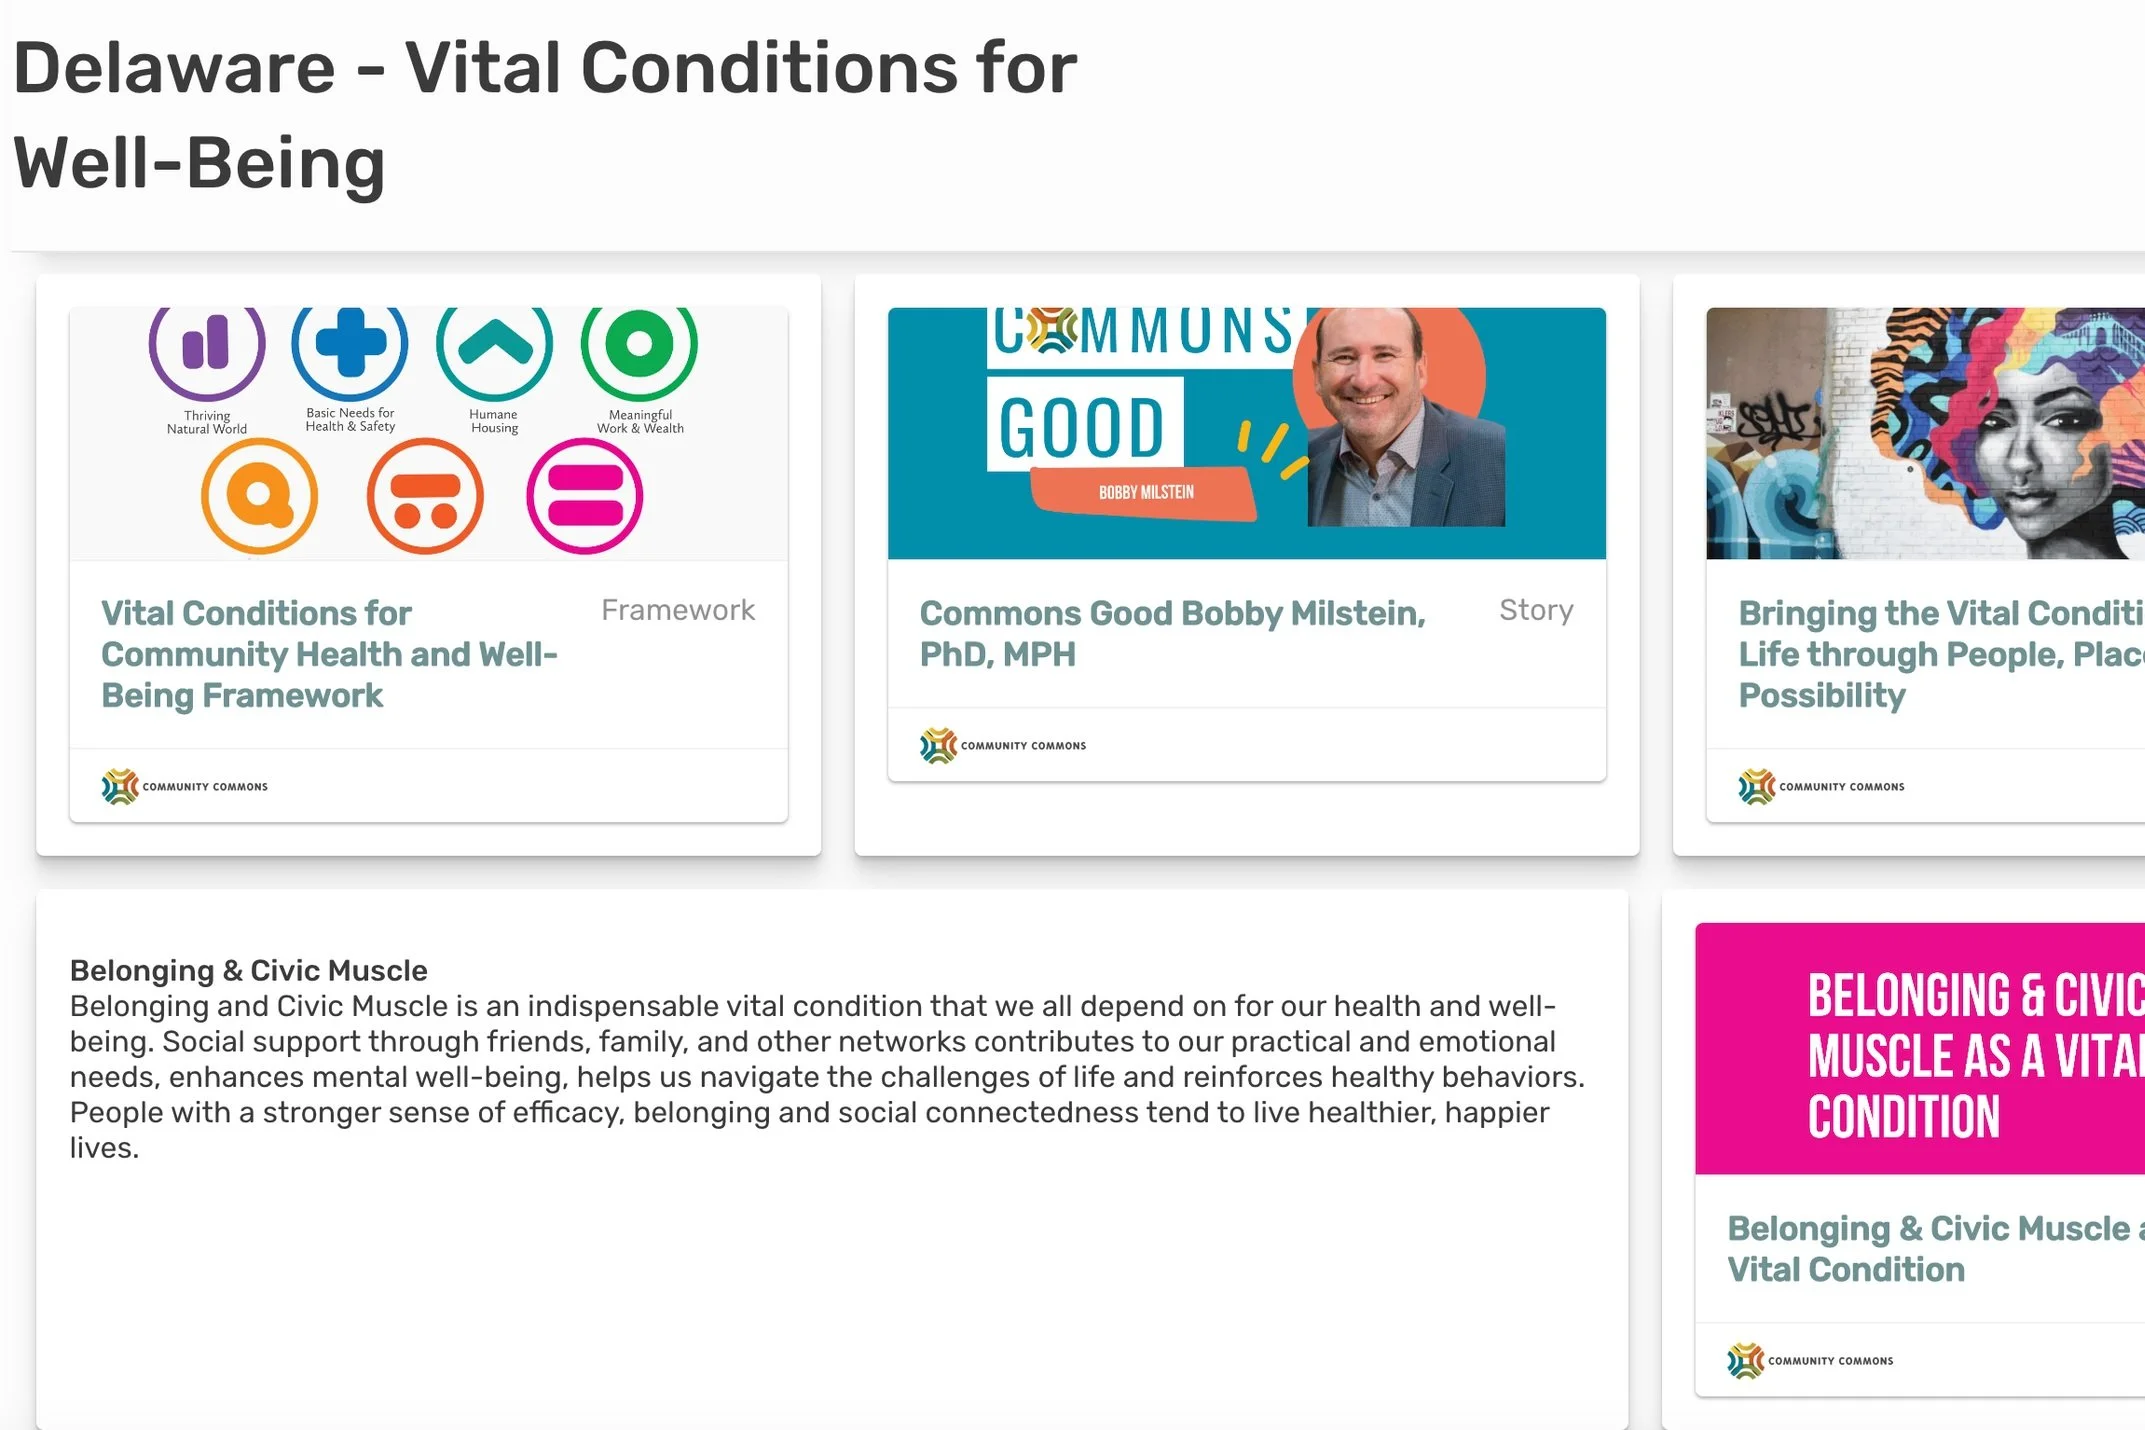
Vital Conditions for Well-Being
Though access to IP3 ASSESS, Healthy Communities Delaware can explore and share data organized by the Vital Conditions framework with communities, organizations, and collaboratives around the state.
-
![]()
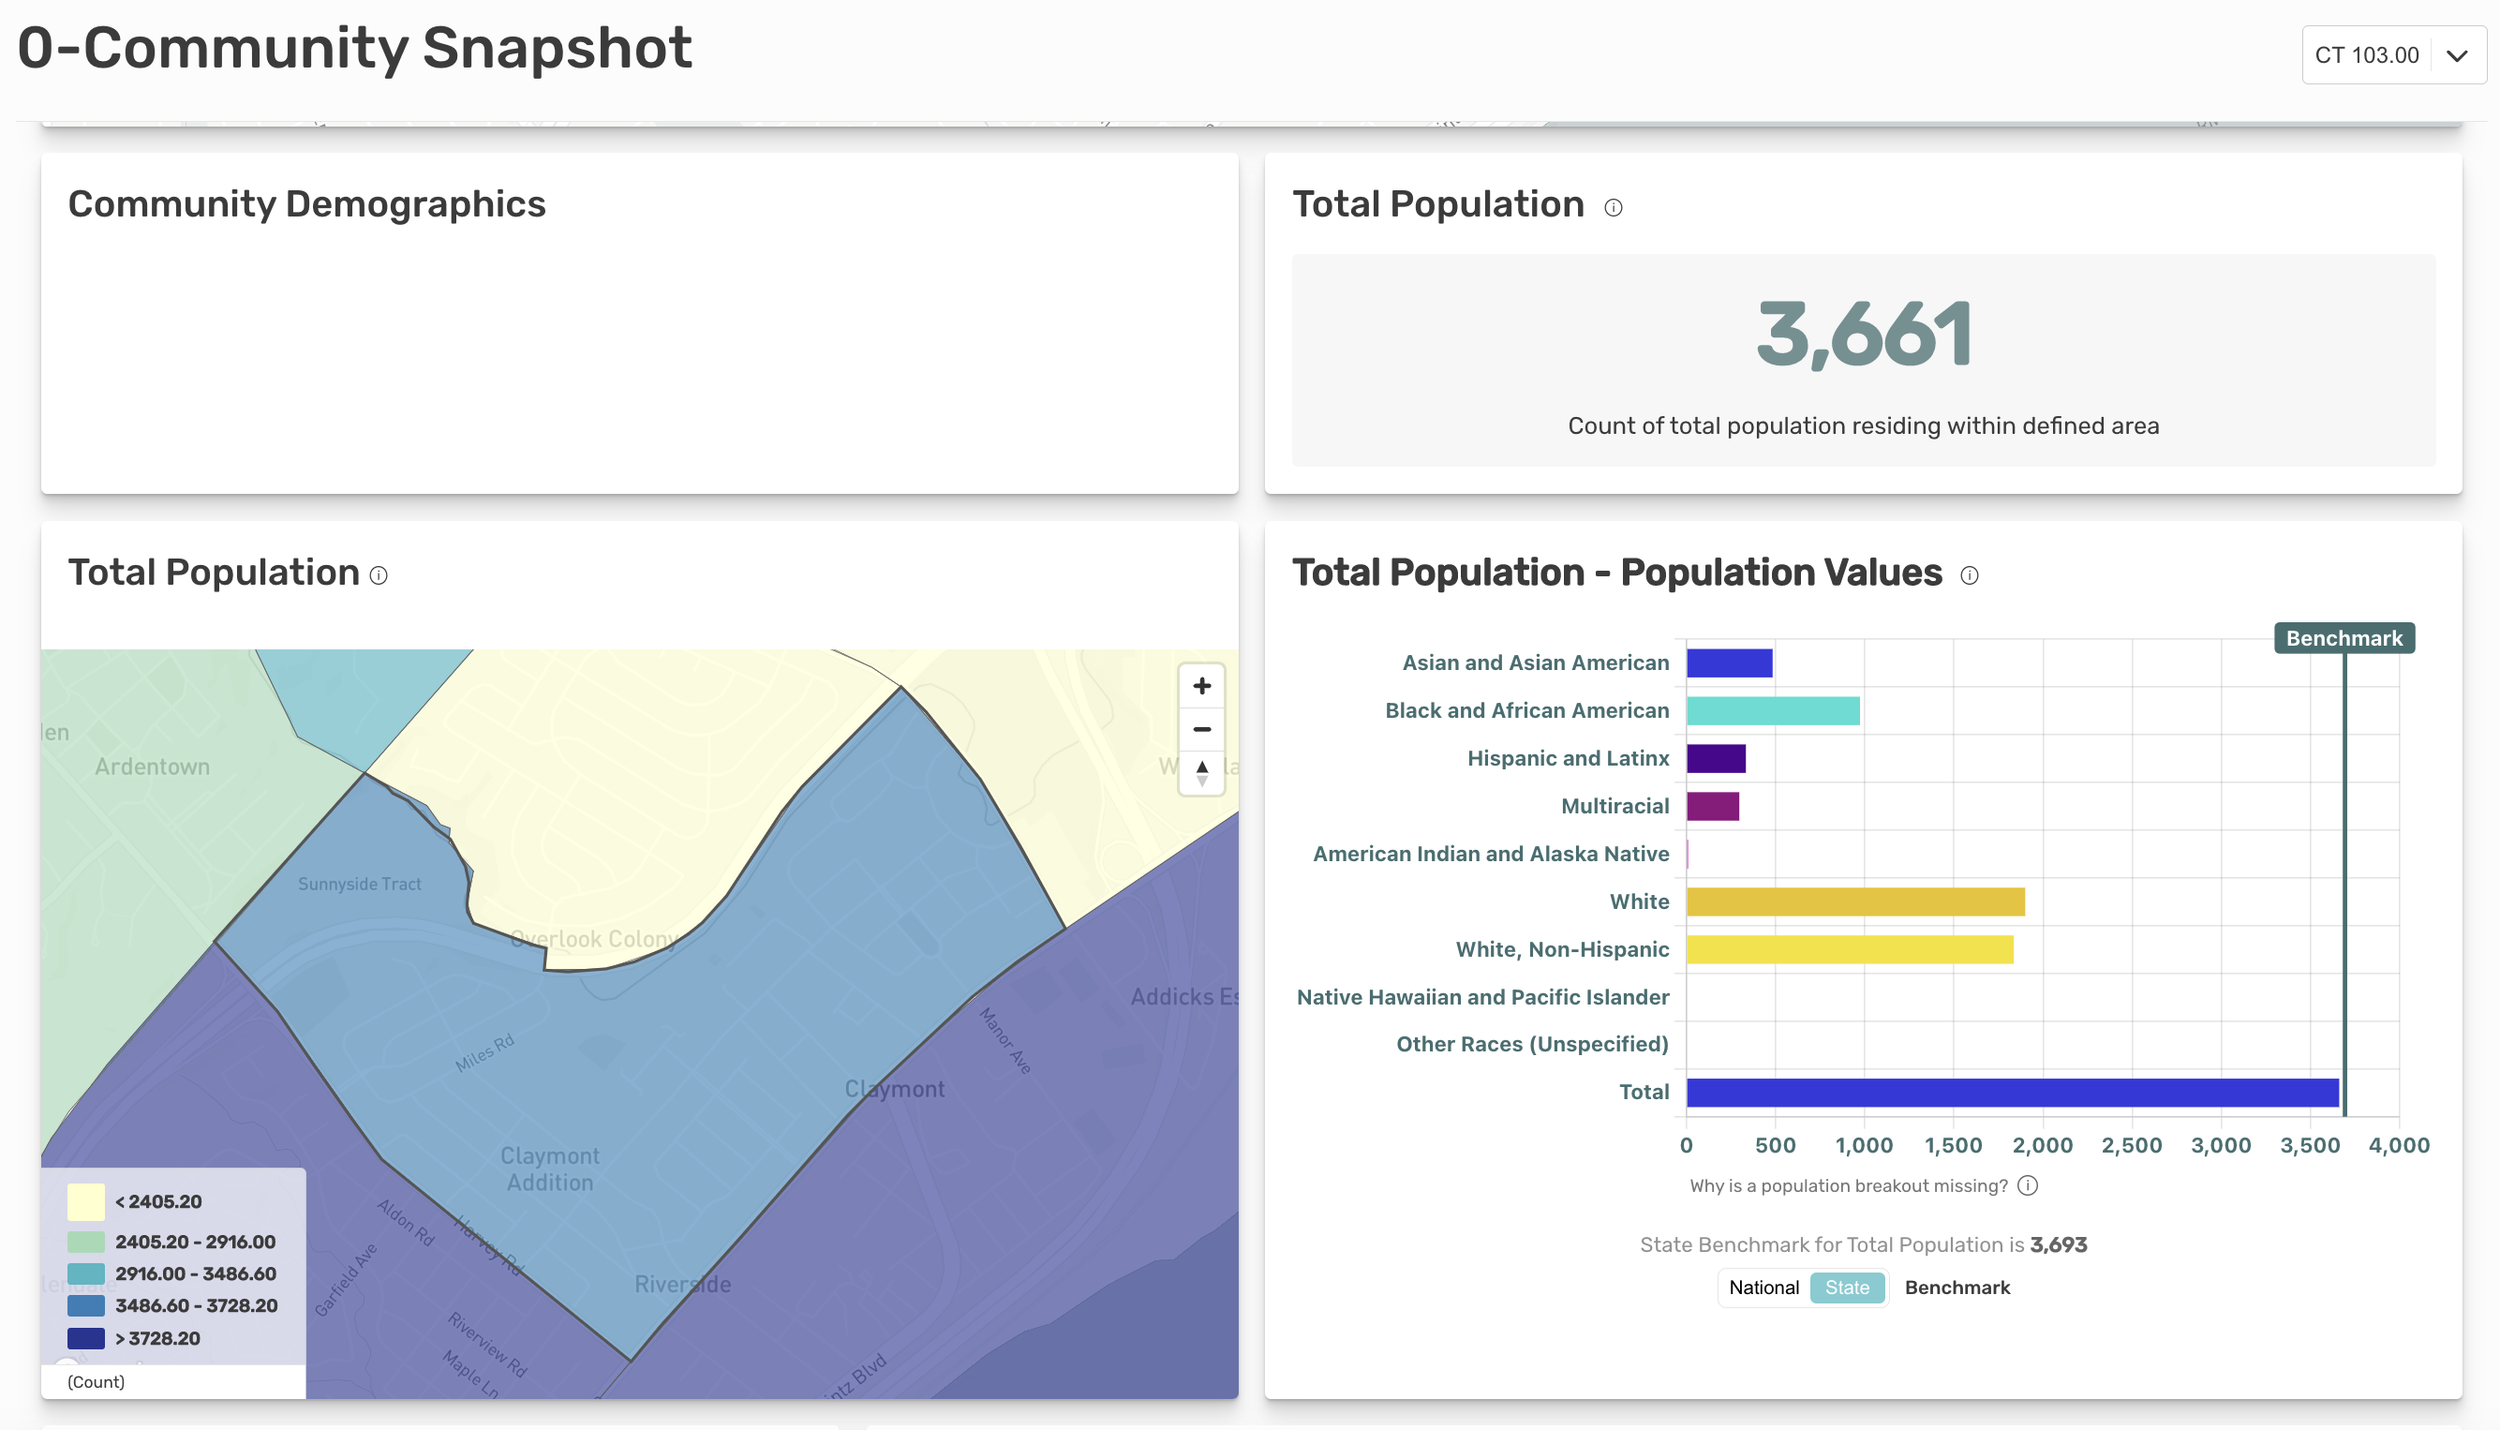
Community Snapshot
Healthy Communities Delaware uses IP3 ASSESS to explore and share data with communities, organizations, and collaboratives around the state. Through a Community Snapshot report, their team explores and shares demographic data and other key community description indicators for areas as small as a census tract.
-
![]()
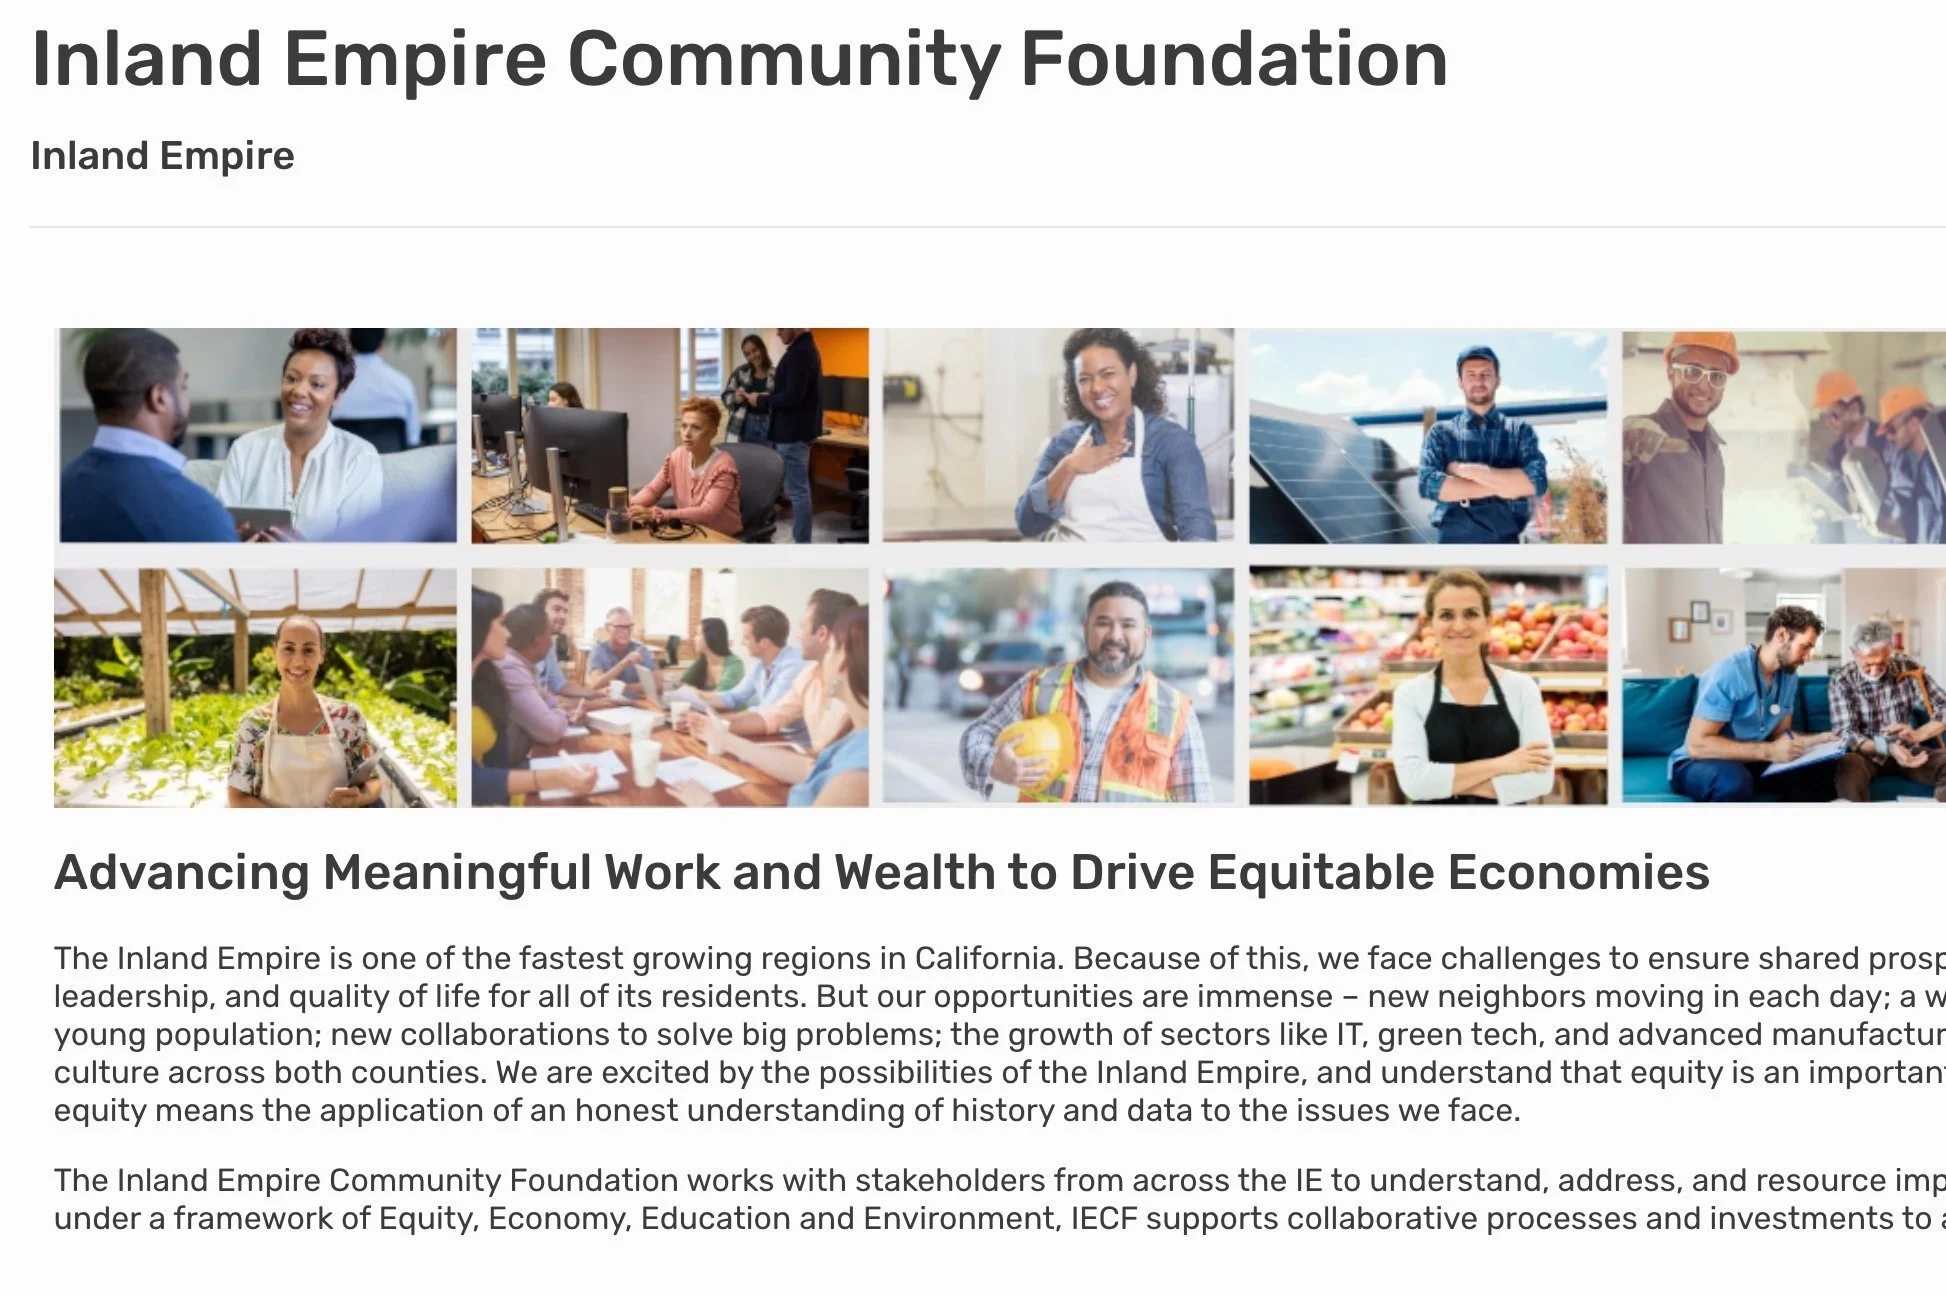
Inland Empire Community Foundation
The Inland Empire Community Foundation works with stakeholders to understand and address important issues. Working under a framework of Equity, Economy, Education and Environment, IECF supports collaborative processes and investments to affect lasting change. IP3 ASSESS helps their group explore data to inform the work and spotlight meaningful community momentum.
-
![]()
Drivers Influencing Social Connection in Communities
The Foundation for Social Connection has launched a dynamic Action Guide for Building Socially Connected Communities that supports local leaders and changemakers to build more social connection across communities. The IP3 ASSESS data dashboard makes social connection data available for every county in the U.S.

-
IP3 ASSESS Focus is an add-on feature for IP3 ASSESS that provides a way to compare data for specific geographic areas, based on a customized, pre-determined set of measures and indicator weighting.
-
Multiple user roles enables different levels of access for different people on your team or from your group of stakeholders. Roles vary from view-only access to ability to create custom reports, to adding additional log-in users to the platform.
-
Select one of your custom areas to use as a regional benchmark. For example, compare individual counties to your organization’s entire multi-county catchment area along with the built-in state and national benchmarks.